Swallowing bitter pills...
...the pills are harmless - the poison's in the sugar, James St. James
Penny clearly did not like my book, Python for Geospatial Data Analysis:
The concepts are articulated poorly and there are places where the code doesn't run, variables are out of order, punctuation missing. I was able to correct things and get it to run, but I am very disappointed in the quality of this book. Also, I wouldn't call Landsat data high res by any means.
I tell my fellow authors, you can’t believe the hype if you aren’t going to believe the insults. Her review is puzzling though because the code is on GitHub since the book is simply a snapshot in time and if I had a nickel for every thing in Python with a deprecation warning you and I could be on an island sipping piña coladas.
Tech reviewers comb through the book and O’Reilly is no joke with getting books proofed and out the door. I am not saying there aren’t missed dangling things and typos but geez. My point in all of this is the last stinger. I would believe that this was written as full res somewhere and perhaps edited to high res — who knows. Put a pin in the high res for a minute. We’ll get back there…
This crappy review did inspire me to spend a little time with the newsletter to be available to clarify or answer questions folks have on their geospatial journey. Regardless of if you have purchased one of my books or not, I think it is handy to have a place for conversations and clarifications. If you have a nice review, please share it on Amazon. The outcome of weighting reviews is not simply a tally of ratings — it is a blackbox decision.
I wanted to close out the Whitebox Workflows with a walkthrough of John Lindsay’s YouTube demo. He is a better resource to describe the ins and outs of the open-source GIS platform he co-created in the detail it deserves but I always like to give demos a spin with my own data. We will return to WBT again.
With a nod to my new friend Penny, I want to point you to free high resolution raster data.
GISGeography lists 15 Free Satellite Imagery Data Sources but for me, number 5, DigitalGlobe Open Data Program with a link to MAXAR was just what I was looking for. Listed as an Open Data Event you can scroll down and access data from the earthquakes in Turkey and Syria from February 2023.
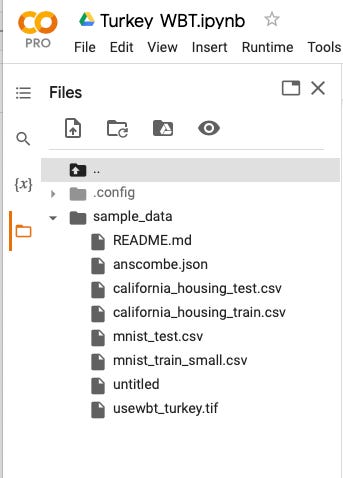
Download the saved file to your computer in a place you can easily locate as we are going to upload to both QGIS and Google Colab. I am using a jupyter notebook to share the notebook with paid subscribers if you are interested. I love the ease of colab’s folder hierarchy. Working directories and downloads and uploads are easily visible. Your files for your WBE will be in the root directory—visible when you click the little orange folder and then the black folder icon with the up arrow.
Penny, apologies for my “poor articulation”. I forgot to mention the point of this exercise. John is showing us how to apply a bilateral filter to our raster image. He is scripting in Python because at the moment, WBT does not have a highpass filter. The code is transforming our RGB color data to a weighted average of intensity values, preserving edges and smoothing the noise in the filter. This seems useful for exploring the post-event earthquake landscape in Turkey and Syria.
Here is the part cut off in the previous snapshot…
I downloaded the files from Colab and uploaded them to the QGIS canvas.
Here is the uploaded Maxar data in QGIS.
Here it is again, with the bilateral highpass filter as the top layer. You can see the edges and perhaps with a little more tweaking of the filter, you could see even more detail.
Thanks and feel free to add any questions to the comments.
Upcoming Conference Keynotes and Presentations (LIVE):
Diversity Co-Chair
Link to Colab notebook below…
Keep reading with a 7-day free trial
Subscribe to Open-Source Solutions for Geospatial Analysis to keep reading this post and get 7 days of free access to the full post archives.


