


Quietly plodding along...
adding 3D renders to your workflow

If you are curious about 3D rendering in Blender I certainly can’t blame you. I have a bit of a complicated workflow as a story builder because I am present when these are live in a conference setting and yes the narrative matters. But the skills are pretty cool and if you have been curious and interested in adding them to your workflow — your audience will thank you. I am talking to you #deathbypowerpoint.
I purchased the latest MacBook Pro powered to do all of these renderings (and Unreal Engine) but what if you don’t have the local compute but want to join in?
Well dear reader, you can also build out in the cloud by integrating Google Colab into your workflow. I use the Pro version which is only about $10 per month and provides remarkable speed and longer run times. Having said that, I did not stick around and render an image of high resolution but this is the workflow that you would use. The region I rendered in Blender, Rocinha, is notoriously complex with multiple textures and shapes. If you, as a sane person, select something less complicated it should render fine.
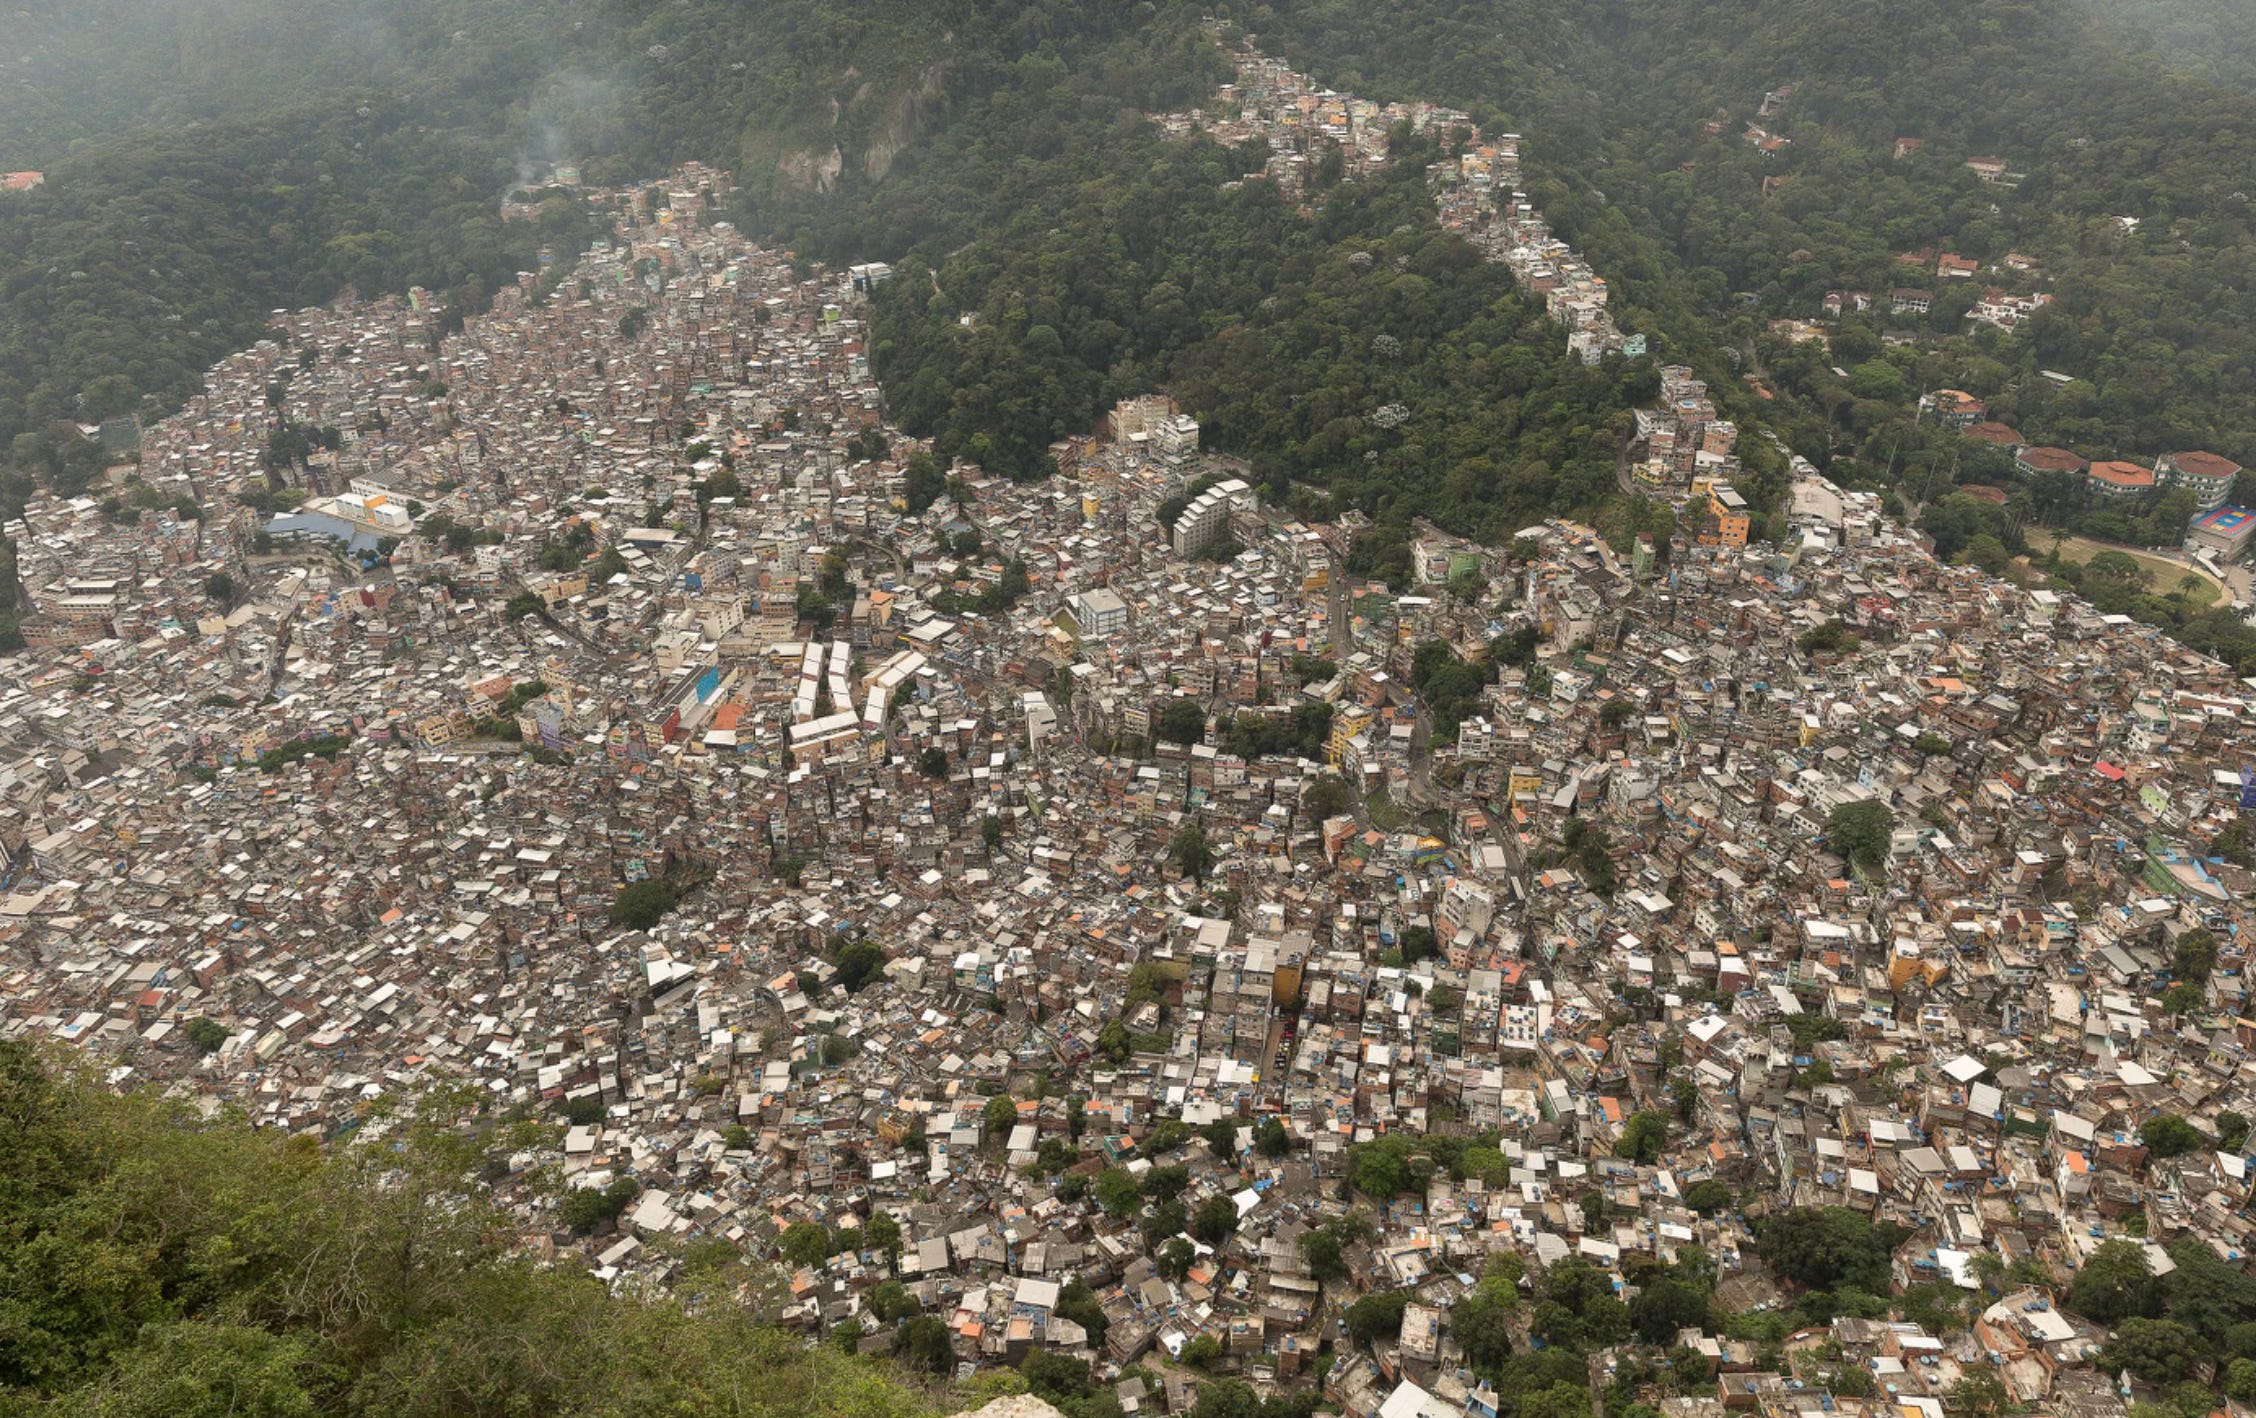
Rocinha (Portuguese pronunciation: [ʁɔˈsĩɲɐ], lit. 'little farm') is a favela in Brazil, located in Rio de Janeiro's South Zone between the districts of São Conrado and Gávea. Rocinha is built on a steep hillside overlooking Rio de Janeiro, and is located about one kilometre from a nearby beach. Most of the favela is on a very steep hill, with many trees surrounding it. Around 200,000 people live in Rocinha, making it the most populous in Rio de Janeiro.[2]
There are a few settings you can optimize before saving your file but they are dependent on the image you select.
The Python code is here in the Colab notebook. I am not a developer and did not originate the code but I am pretty good at troubleshooting and making adjustments. Here is where I plug the book, Python for Geospatial Data Analysis: Theory, Tools, and Practice for Location Intelligence 1st Edition only because it was the lever that allowed me to perhaps not become a coder but to be a spatial analyst that is able to access a vast amount of libraries fairly confidently in record time.
Read through the instructions carefully — any mistake I made out of the gate is because I rushed through and missed something straight forward.

I included the video I adapted the code from on YouTube at the end of this post. Download the ipynb listed by the author (no instruction in video, you follow a cursor) with the video or you can use the one I updated. I had to do a nudge here and there to get it to work for 4.4.3 as video is 4.1 I think but doable.
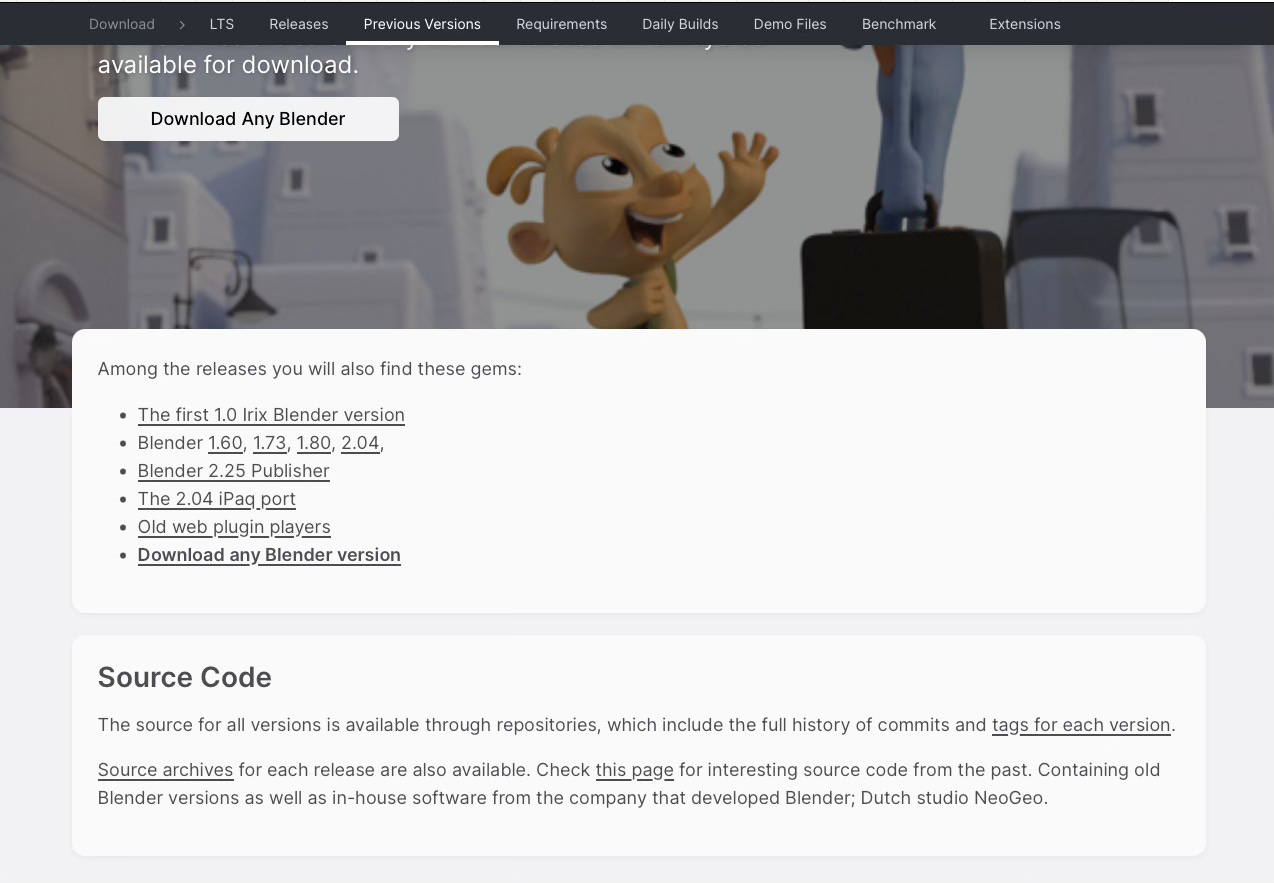
To find the blender file path for the version of blender you’re using go to the website for blender and click Download Any Blender. Your tar file will be listed.
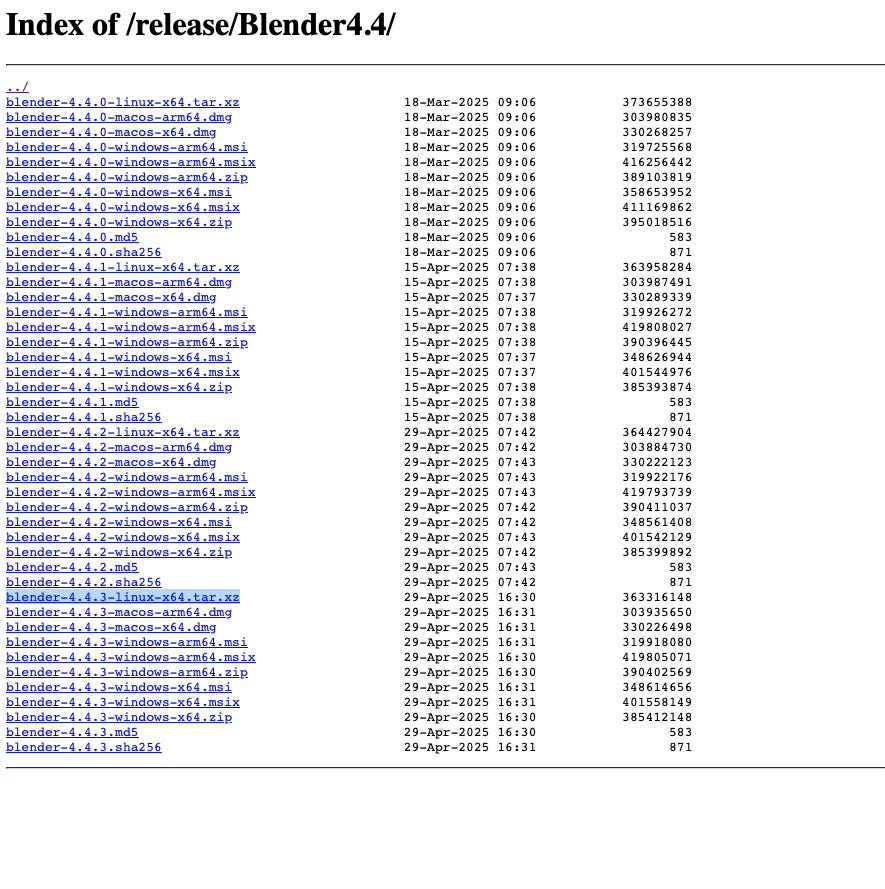
Scroll down the index to find your link to include in the Colab notebook.
After successfully running the cells, you will have a JPEG download of your image!
Good luck! Reach out with any questions. Happy to make a video of the exact process is there is interest.
Resources:
The book I suggest for deep dives into programming didn’t exist when I began my journey. Lucky you…

Introduction to GIS Programming: A Practical Python Guide to Open Source Geospatial Tools
*affiliate links support my work in the tiniest way but it is support nonetheless.
Thanks for reading. Add a question or comment and we can continue the conversation.
It's the steady, quiet, plodding ones who win in the lifelong race. Robert W. Service