Let the carnival barkers bark...
Not sure what is happening to geospatial conferences but I have noticed a swing from bringing in notable speakers across the spectrum to bringing their clients of various software and adjacent businesses to the podium for a bit of “soft” selling to the audiences. Your registration fees have been earmarked for a sales event with mediocre food and your avatar now lives in databases to guarantee a marketing funnel requiring you to evoke Houdini like expertise to disappear.
Here is a recent example. A large earth and space science conference asked me to submit a proposal as an invited speaker. There was a fee to submit an abstract, a fee to register for the event, and a fee to join the organization. I only agreed to join the organization. The registration was waived and believe or not the individual requesting my talk paid the abstract fee on my behalf.
Fast forward about a month and the event organizers accepted my talk as a 3 minute eLightening talk. A category I didn’t even realized existed. It reminded me of an Elsevier Urban Transitions event where they thought I could give a talk about geospatial storytelling with a poster.
To close the loop, here is the title of the talk:
A geospatial perspective on the social metabolism of cities: open-source solutions for examining the sustainable frameworks of built infrastructure through quantitative storytelling.

I am not wasting my time (or yours) to use the format of a carnival barker to share what I believe to be vital resources and information about creating value for your geospatial data questions. I declined.
I have dialed back my conference travel and will remain selective as to where I engage. Maybe when their pez dispenser of willing speakers empties the business model will evolve.
But until then I will continue to update the geospatial storytelling course on Udemy, Data visualization for better geospatial storytelling. This newsletter will continue to have paid subscriber benefits but also freely accessible resources. So far, I have been sharing from the work in progress Locate Press book, Geospatial Data Science & the Art of Storytelling.
My free resource of the week is from Spatial Thoughts and the Reveal Mask:
Here is a reveal mask I created with QGIS…
I have written in the past about quantitative storytelling and the use of labor statistics when calculating labor and technology (funds) to explore the metabolic pattern of social-ecological systems.
OECD statistics, Measuring labour input: is it about quantity, quality or both?
A worthwhile read if you share my interest in differentiating between internal requirements of production factors and resulting environmental pressures.

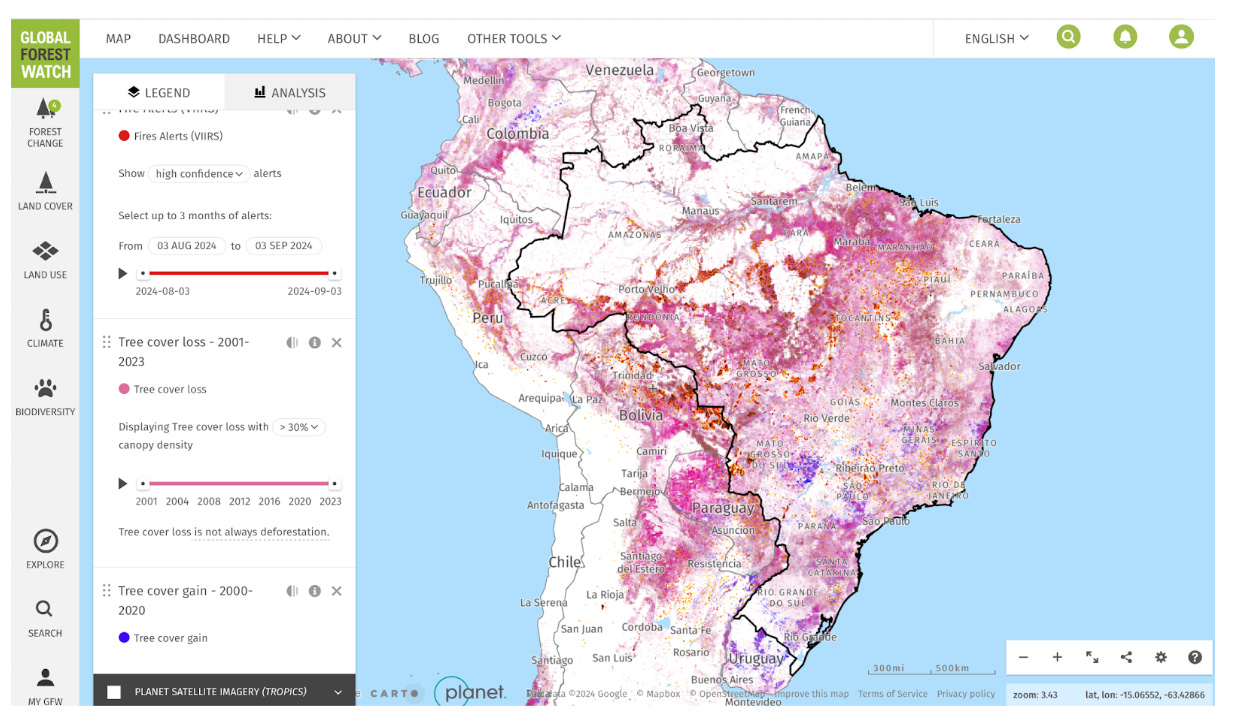
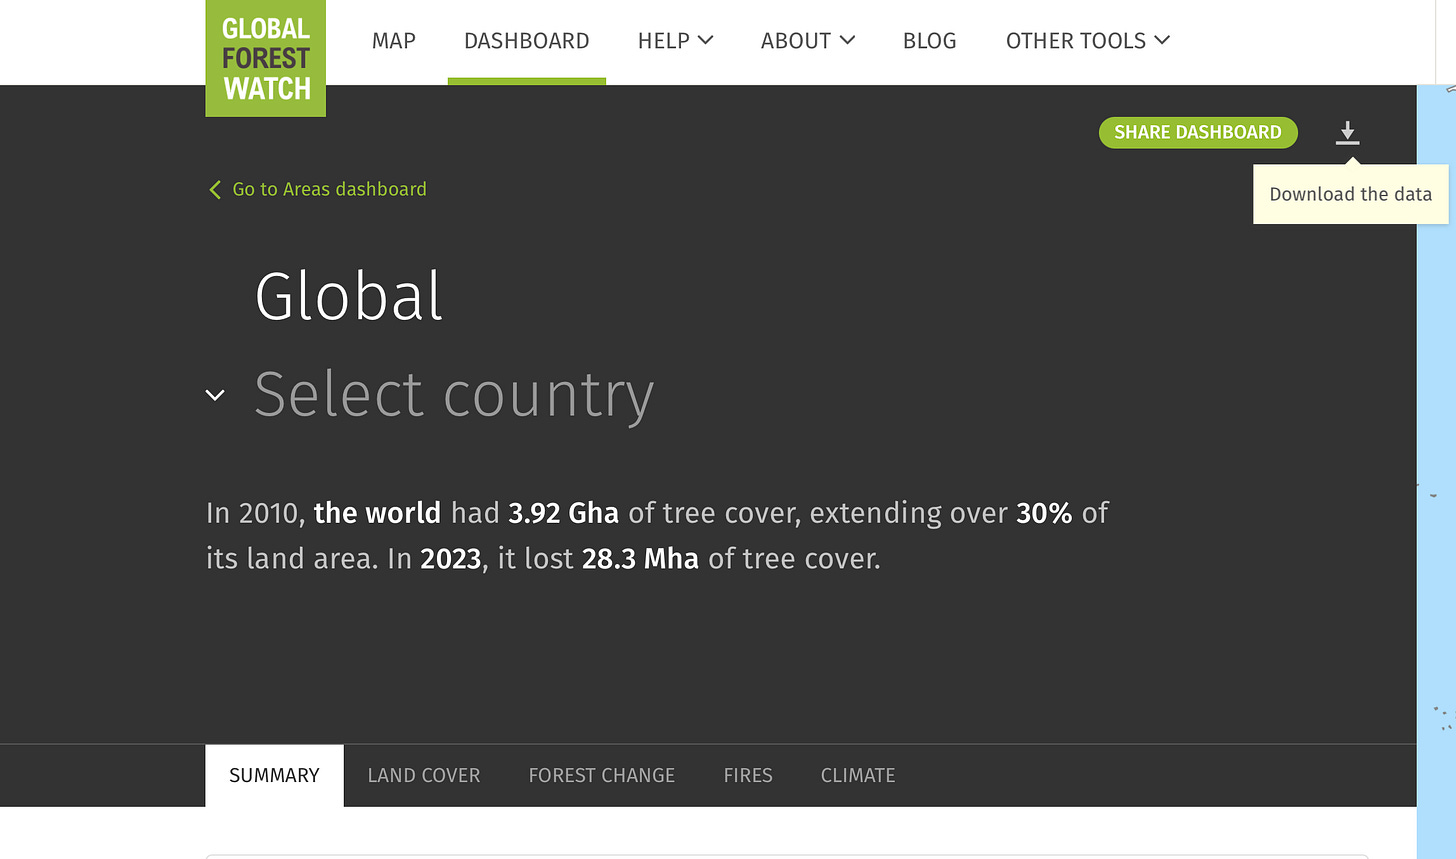
The sixth chapter in my upcoming book I decided to title, Deforestation in Brazil. I list resources for deeper exploration but I also pause to share how to download data from a database and dashboard like Global Forest Watch to your local computer for your own analyses. Interactive dashboards can be informative but often have multiple layers of data that you would like to import into QGIS for example.
Global Forest Watch (GFW) at first glance readily allows downloads but in xlsx format—yes you can create csv files. But you can also access other formats. Let me show you how to bypass the Download the data button on the dashboard.
Keep reading with a 7-day free trial
Subscribe to Open-Source Solutions for Geospatial Analysis to keep reading this post and get 7 days of free access to the full post archives.


